
I recently started programming native addons but couldn’t find how to debug them easily. After couple nights, I found very easy solution described below.
To debug native addons generate an xcode project file. From the root of your project (where binding.gyp lives) run:
|
1 2 |
node-gyp configure -- -f xcode |
This will create ./build/binding.xcodeproj folder, which you can open:
|
1 2 |
open build/binding.xcodeproj |
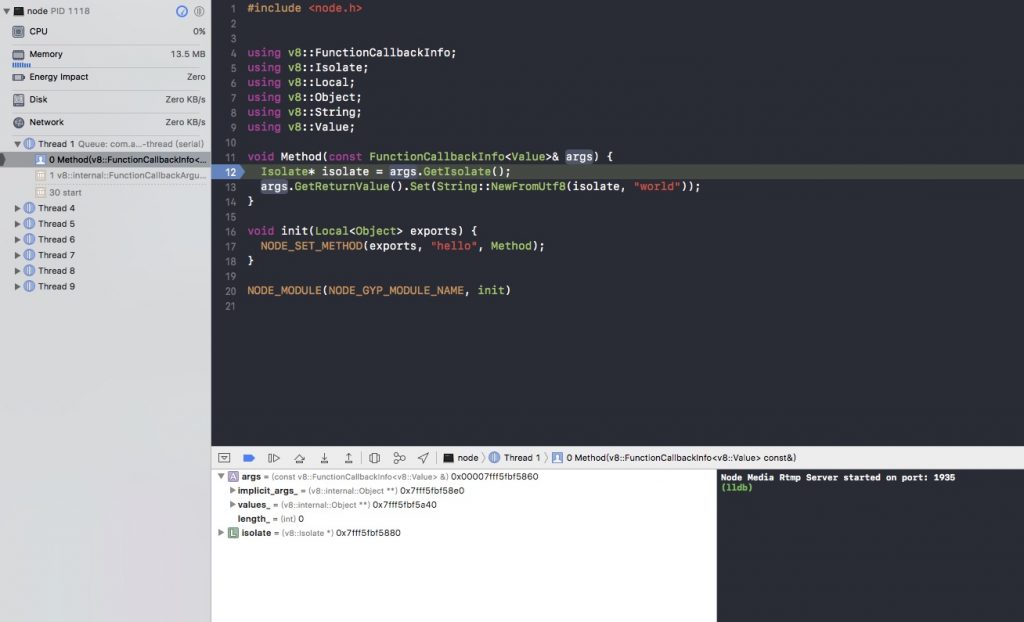
Once project is opened, make sure to configure the scheme. Open Product -> Scheme -> Edit Scheme, and then:
- Select
Info -> Executable -> Otherand enter path to node executable - Select
Argumentsand enter full path to the javascript file which invokes native addon.
原创文章,转载请注明: 转载自贝壳博客